Project Hessdalen logo
HESSDALEN
Holtålen municipality
Pictures
Map
Hotel
Guided tour
Where is
3D map
 
PHENOMENA
Pictures
Film
Description
Observations this year
Observations previous years
Theories
 
PROJECT
Last news
Articles
Report from 1984
History
Talks
The project in TV
   ... radio/internet
   ... newspaper
   ... journals
 
STATION
Live TV

Alarms

Pictures 2024
Pictures 2023
Pictures 2022
Pictures 2021
Pictures 2020
Pictures 2019
Pictures 2018
Pictures 2017
Pictures 2016
Pictures 2015
Pictures 2014
Pictures 2013
Pictures 2011
Pictures 2003
Pictures 2002
Pictures 2001
Pictures 2000
Pictures 1999
Pictures 1998

GCP

Technical description
Where is

 
PEOPLE
Student groups
Student reports
 
OTHER
Become a sponsor
Links
 
Hits on this web
Back to main
 
   
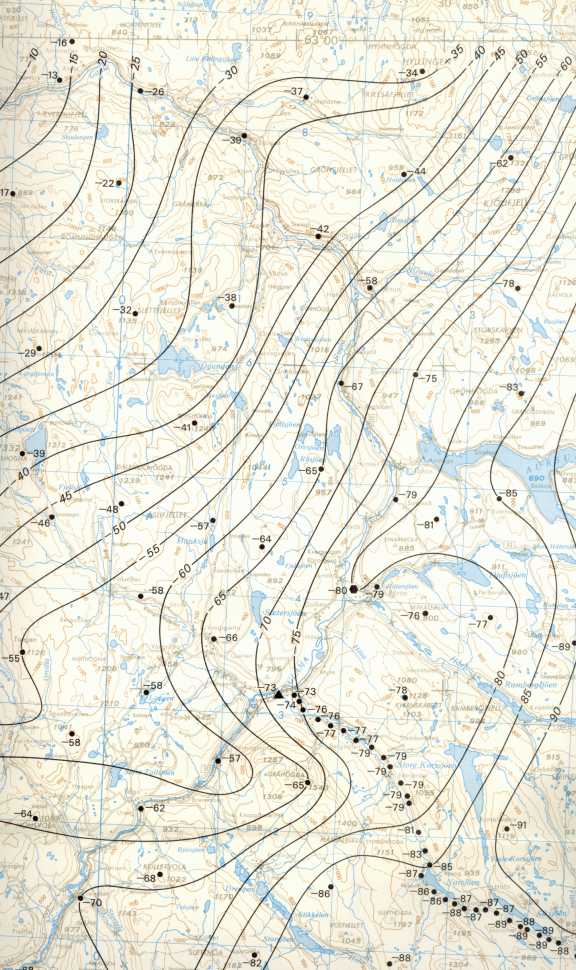
Map of the gravity anomali in the Hessdalen district

Map of the gravity anomali in the Hessdalen district. (middle)

Terraincorrected Bouguer anomalies. The numbers in the map indicate gravity anomalies in MGAL. Black curves indicate negative anomalies. Contour interval for the anomaly curves 5 MGAL. Density 2,67 g/cm3.

One square (blue line) in the map, equal 10 km.


Copyright ©2000 Project Hessdalen. Webmaster : Erling Strand.
All comments or questions about this web shall be send to Webmaster
Last update 07 May 2002 15:48:55.

nor-flagg