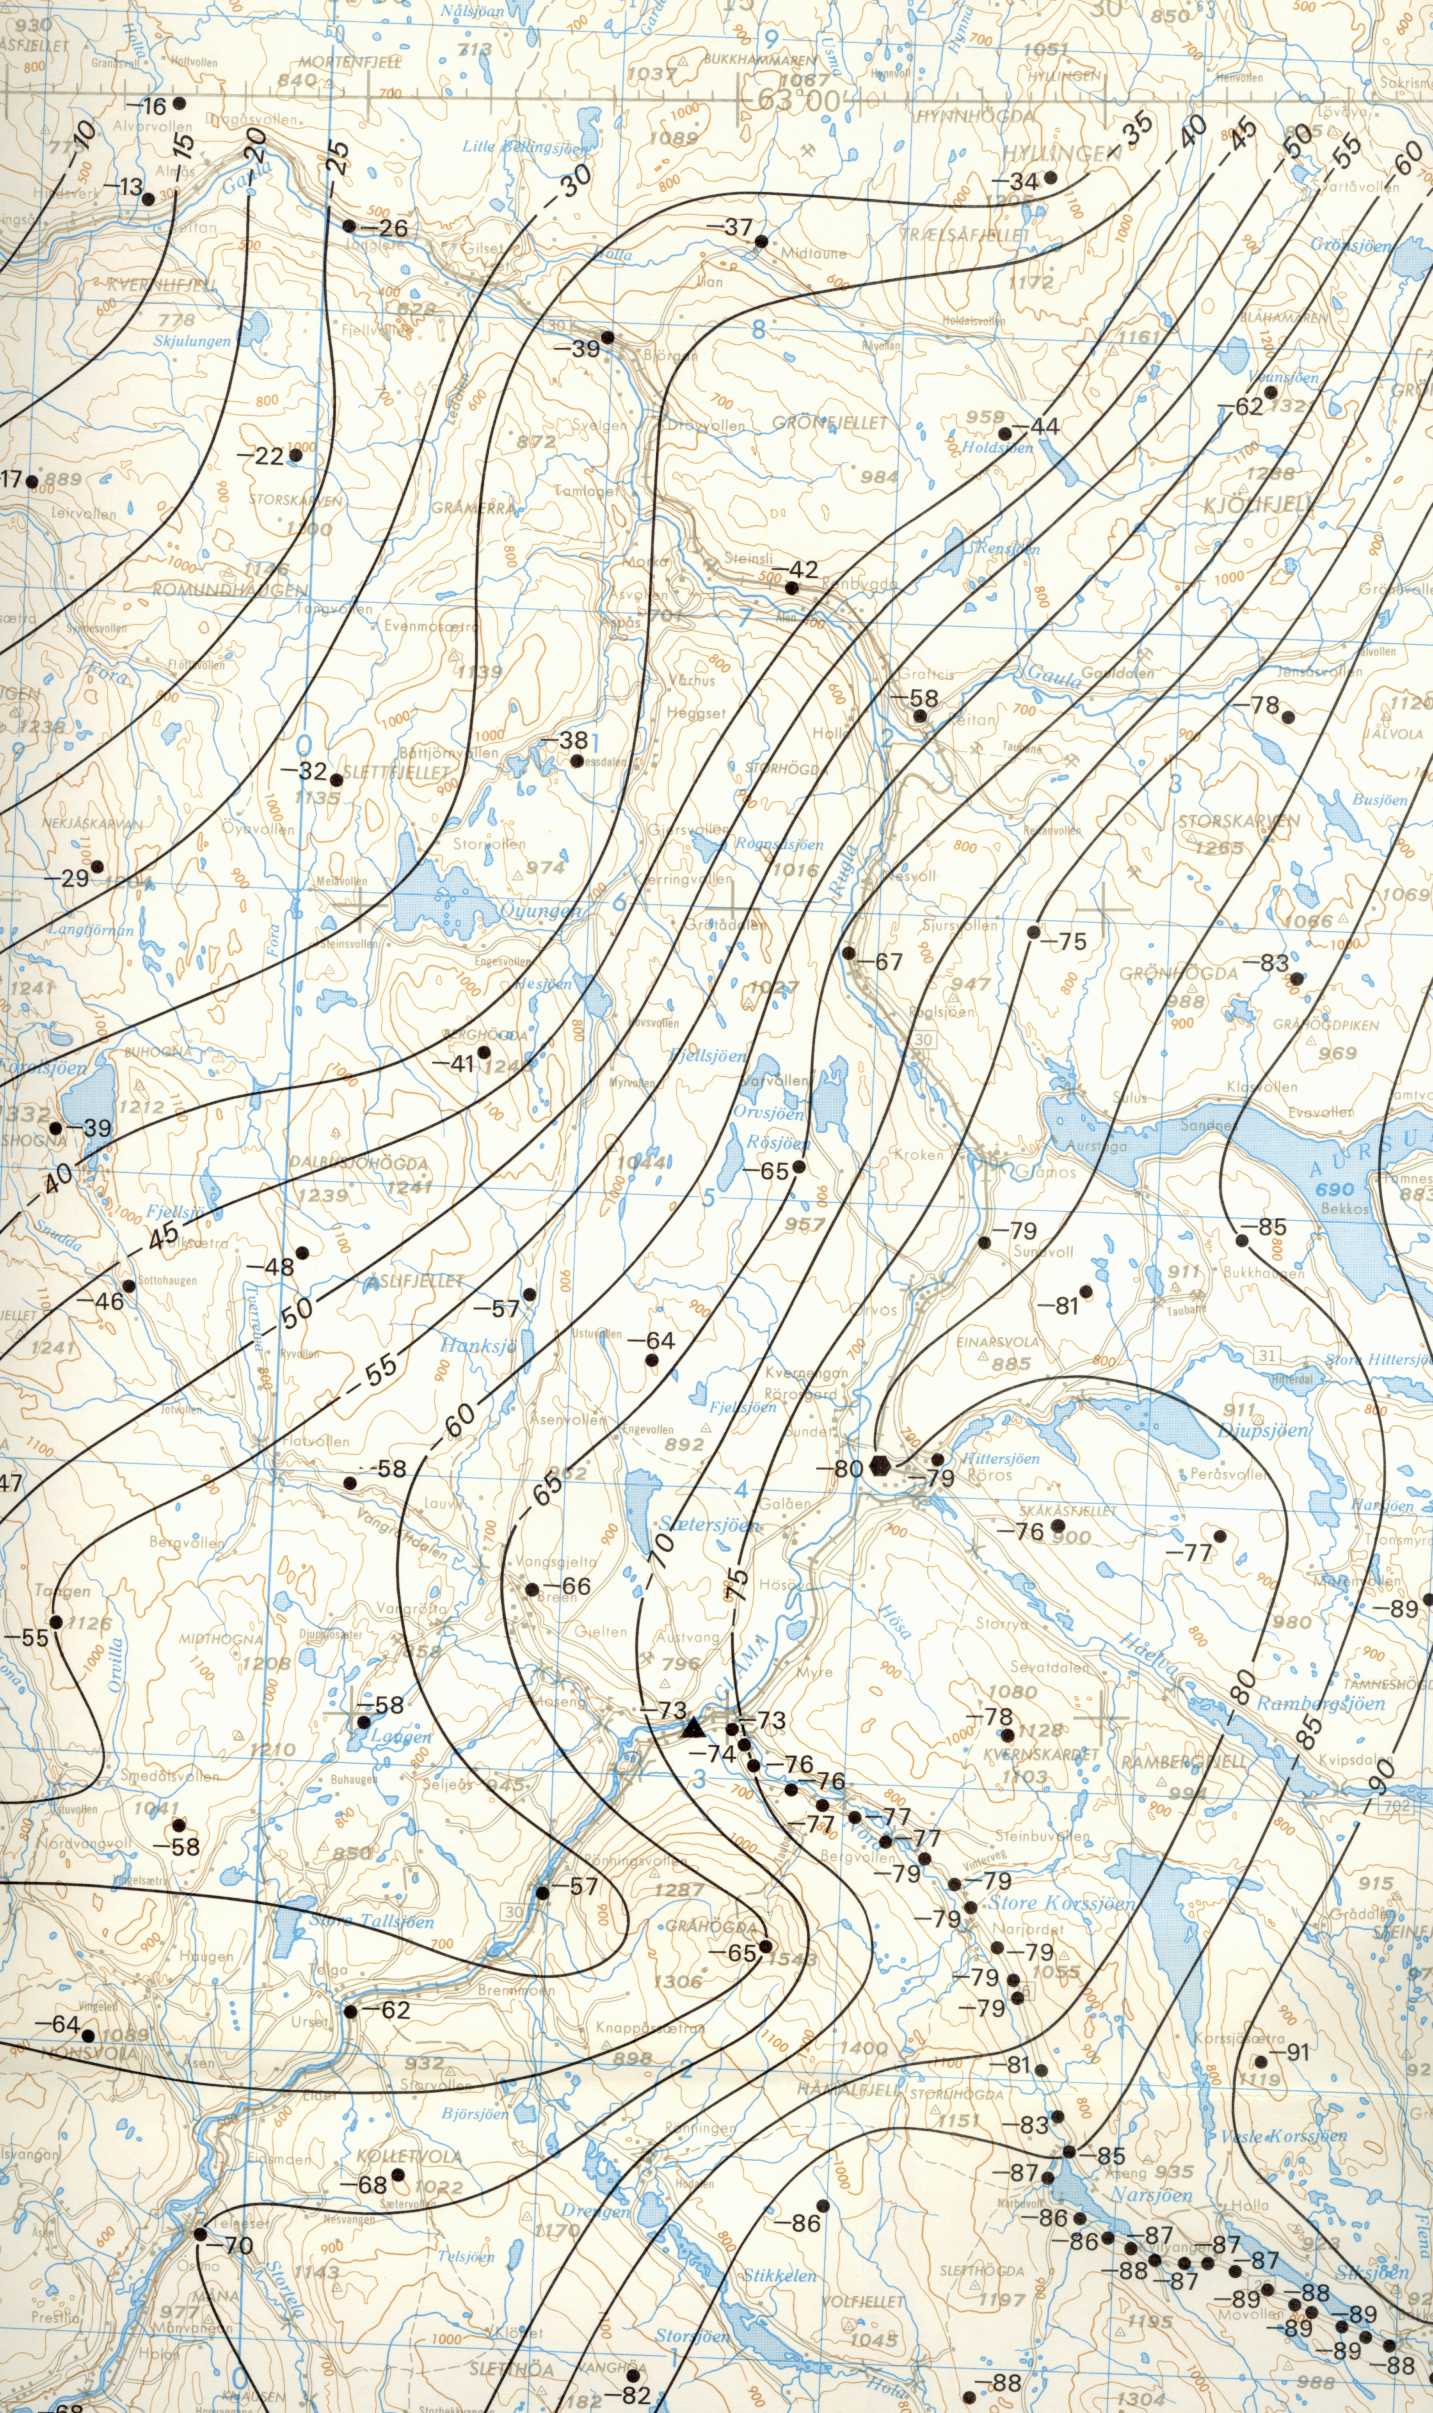
Map of the gravity anomaly in the Hessdalen district.
The numbers in the map indicate gravity anomalies in MGAL. Black curves indicate negative anomalies.
Contour interval for the anomaly curves 5 MGAL. Density 2,67 g/cm3.
One square (blue line) in the map, equal 10 km.

All comments or questions about this web shall be send to Webmaster
Last update
07 May 2002 15:48:55.
