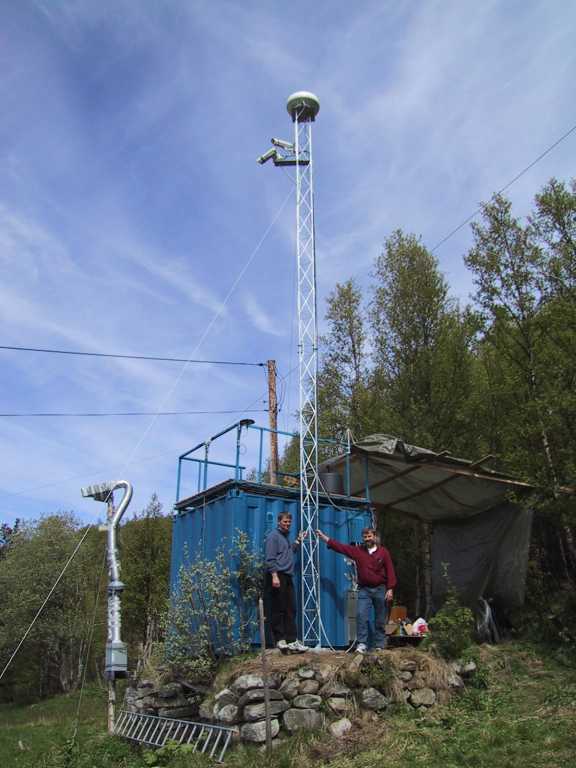

A brief description.
The station has three camera systems:
- Two-camera system.
Two CCD color camera with
H:92° V:71° lens,
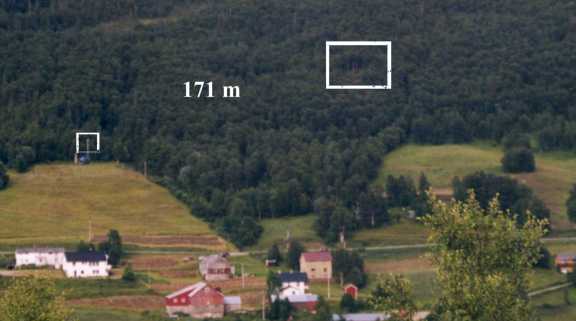
Cam1 and Cam2, are located 171 m apart, pointing towards west. The analoge videosignals from these
are connected to a clock-and-date unit, which put the clock and date info on to the
pictures. From this unit goes the video signales to the video-recorders and the to each
video card in the two-camera computer.
The two-camera computer has a Red-Hat Linux operating system. There is a software in this computer
which each second analyse the pictures from the two cameras.
If there is a light in both cameras these pictures will be defined as "alarm pictures",
and tranfered to this web. The direction of this light will be sent to the pan-tilt computer.
The video-recorders start recording, and they do that for 15 seconds or until the light has disappeared.
A part of the pictures from the cameras will not be analysed. It is where houses and roads are located.
The two-camera system does also take a picture every hour,
which are transfered to this web.
- Pan-tilt system.
On the pan-tilt unit is a
color camera with a zoom-lens located.
The analoge videosignal is connected to a clock-and-date unit, which put the clock and date info on to the
picture. From this unit goes the video signal to a video-recorder and the to a
video card in the pan-tilt computer.
The pan-tilt computer is steering the pan-tilt unit in the direction it gets info about from the two-camera computer.
When the pan-tilt unit has come to the direction the first time based on an alarm, it takes an alarmpicture with the zoom camera,
which is transfered to this web.
The pan-tilt computer do take a picture every hour which are transfered to
this web. This is mainly done due to get the axes in the pan-tilt unit can move
each hour.
The pan-tilt unit is pointing the camera down when it is in rest.
Red Hat Linux operating system is uset in the pan-tilt computer.
- Black-and-white system.
There are two black-and-white camera systems. The old SGI-system, BW2, and the new SH-system, BW1.
It is close to the same software in both these systems. The SGI-system is old, so the SH-system
will take over this system. Both system will be run whenever possible.
In the SH-system is it a very sensitive (0.0003 lux)
black-and-white camera, with
Computar
HG3803AFCS lens.
The analoge videosignal is connected to a clock-and-date unit, which put the clock and date info on to the
picture. From this unit goes the video signal to a video-recorder and the to a
video card in the SH computer.
Red Hat Linux operating system is used in the SH computer.
A software read a picture every seconds and analyse it.
If a light suddenly shows up in the picture, which is big enough and move fast enough,
will the picture be an aalarmpicture and transfered to this web.
A part of the picture from the camera will not be analysed. It is where houses and roads are located.
This is done by using a mask picture.
No analyse is done in the red part of this mask picture.
The SH computer take a picture every hour which is transfered to
this web.
A black-and-white Panasonic CCTV camera, type WV-BP310,
with a wide angle lens (H:107°, V:88°), type WV-LA210C3.
is connected to the SGI computer,
which has a software analysing the pictures from that camera. This software use about 0.8 second for each
picture. Whenever there is a change from the previous picture, bigger than a preset
value, the software goes in to alarm-modus.
A video-recorder startes, and the picture that caused this alarm is sent to this web, on page
last alarms.
The SGI computer is a 100 MHz Indy computer with Irix 6.12 operating system.
The computeres transfer the pictures and other data to www.hessdalen.org.
This web-server has also the addressen hessdalen.hiof.no.
It is located at Østfold College, in Sarpsborg.
Other sensors in the station:
- Magnetometer
The SH computer do also read the value of the (earth) magnetic field using the three-axes
vector magnetometer.
Every hour is the average value of the last hour measurements calculated, and transmitted to this web.
The max- and min- value last hour is also transmitted to this web every hour.
There is also another three-axes magnetometer in use. It is a Fluxgate magnetometer, EDA Model FM100.
This instrument does not read the absolute value of the magnetic field, only the variation of the field.
The analogue signals from this Fluxgate magnetometer is connected to the weather computer, which has a software
reading the magnetic field in each direction, X (north-south), Y (east-west) and
Z (up-down), 10 times a second.
Reading that often gives the possibility to detect magnetic pulsations. If there is a change in readings
higher than a preset value, then the signal is defined as a pulsation. All the sampled values in the
pulsation is transfered to this web, so that the curve can be made on this web.
Each minute are the average values for X, Y and Z calculated. This is the minute-values.
Every hour are the last 60 minute values used to calculate the average- max- and min- values for each direction.
These values is transfered to this web. Any pulsation detected last hour will also be transfered every hour.
With this system is it possible to see if there are any specific change in the magnetic field during an observation
of the phenomena.
- Weatherstation
All sensors measuring the weather are connected to the weather computer through an interface unit.
It is wind speed, wind direction, temepratur and pressure. The computer uses Red-Hat Linux operating system.
The temperature and pressure are read 10 times each minute. The max- and min-value of this 10 samples are removed,
and the average value is calculated for the other values. This is the minute value.
Each hour are the average-value, min- and max-value with time, for the last 60 values, and the minute value transfered
to this web. This is for the temperature sensor. The same is done for the pressure sensor, exept that the last
minute value is not transfered.
Wind direction is measured once an hour. Such a measurement is based
on 10 samples, where the max- and min-value are removed, and the average are calculated of the others.
The average are calculted in a way that for instance 359° and 1° will be 0°, not 180°.
The wind speed sensor gives out two values, gust and "now".
The gust value is the biggest value recorded since the last reading of the gust value.
The sensor is read every minute. During one hour there will be 60 gust values, and 60 "now" values.
Max value of these 60 last gust values will be the gust value transfered to this web.
The last 60 "now" values are used for finding the max- and min- value and their time, the average value,
and the max fluency 10 minute wind speed.
The fluency 10 minute value is the average of the last 10 minutes. That is calculated each minute from minute no.10. The
biggest of those 50 values is the max fluency wind speed.
- Electro Magnetic radiation
Two antennas are connected to an amplifier with correlator, and then to the ELFO computer.
ELFO mean Extreme Low Frequency Observatory.
The software is a AI (Artificial Intelligence) program. All EM signals with known origin are saved in a database.
Whenever an EM signal is detected, it will be compared with the known EM-signals in this database.
If the detected EM-signal is equal enough to a known signal, it will not be recorded. How "equal"
it must be can be adjusted. All other EM-signals detected will be recorded and a picture of the signals will be made.
This picture of the EM signal will be transfered to this web.
This computer uses Windows XP operating system mainly because the driver for the antenna amplifier and correlator was
only possible to get in Windows (at that time).
- Reg
This is a "sensor" used in the GCP nettwork.
Similar "sensors" are located many places around the world.
It is a random event generator which over time gives out equal amount 1's and 0's.
GCP has found that these generators are not random anymore when certain strong "happenings"
occur. You may read more of this at GCP.
We want to see if a big observation in Hessdfalen will influence this "sensor".
This "sensor" sendt its data to GCP,
where the analysing are done.
 |
| Hessdalen AMS, the summer of 2001 |
 |
The locations of the two cameras in the two-camera system.
The other cameras are located at the station, the left white square. |
|
