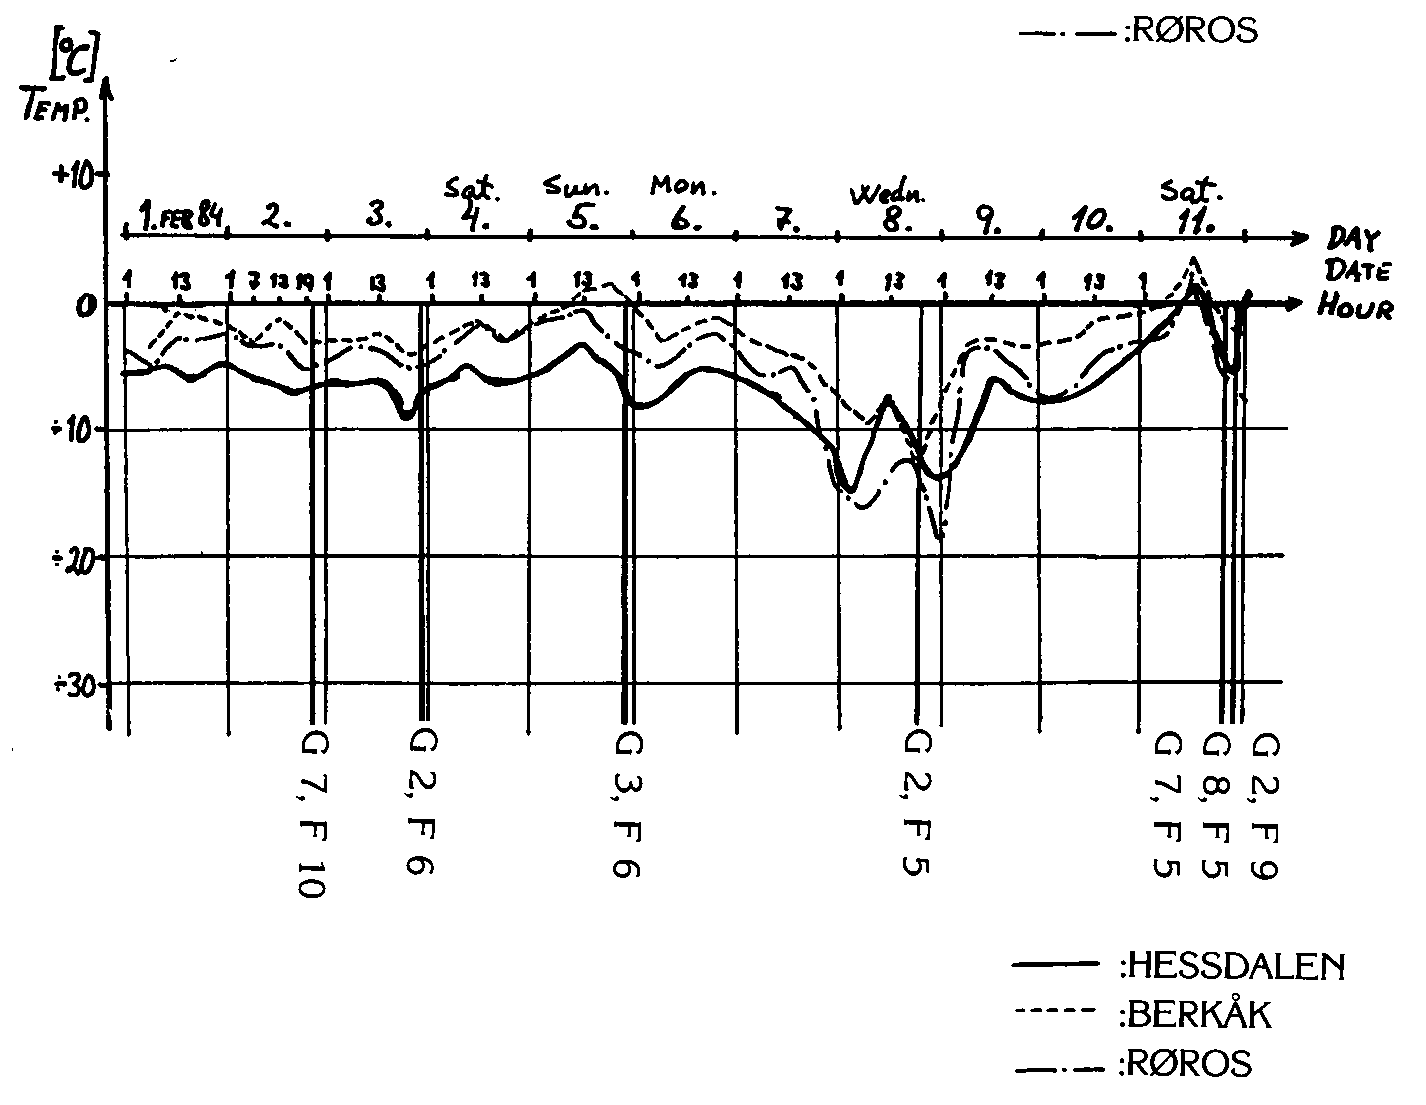
Project Hessdalen - Temperature diagram from 1.February to 11.February 1984
This diagram shows the temperature on three different locations, during the fieldwork
of 1984. It is from Berkåk and Røros, which both are from stations of
DNMI, and some measurement from Hessdalen.
In the diagram you can see when there was an observation with a score of F5
or higher.

Copyright ©2000 Project Hessdalen.
Webmaster : Erling Strand.
All comments or questions about this web shall be send to Webmaster
Last update
07 May 2002 15:53:42.


